
When Futures Overreact: A Weekly Edge Across the Futures Curve
Short-Term Basis Reversal by Rossi, Zhang, and Zhu (2025)

The Premise
Commodity exposure is accessed via futures contracts, which form a term structure across maturities. In the recent academic paper Short-Term Basis Reversal by Rossi, Zhang, and Zhu (2025), the authors hypothesize that futures along the curve incorporate news information at different speeds, where typically the front-month future reacts more rapidly to news than deferred ones.
This difference in price sensitivity can create short-lived misalignments between nearby contracts. The paper explores whether those misalignments can be systematically traded. There’s a repeatable reversal pattern between adjacent futures contracts that offers a measurable trading edge and this edge is both statistically robust and economically significant.
The Idea
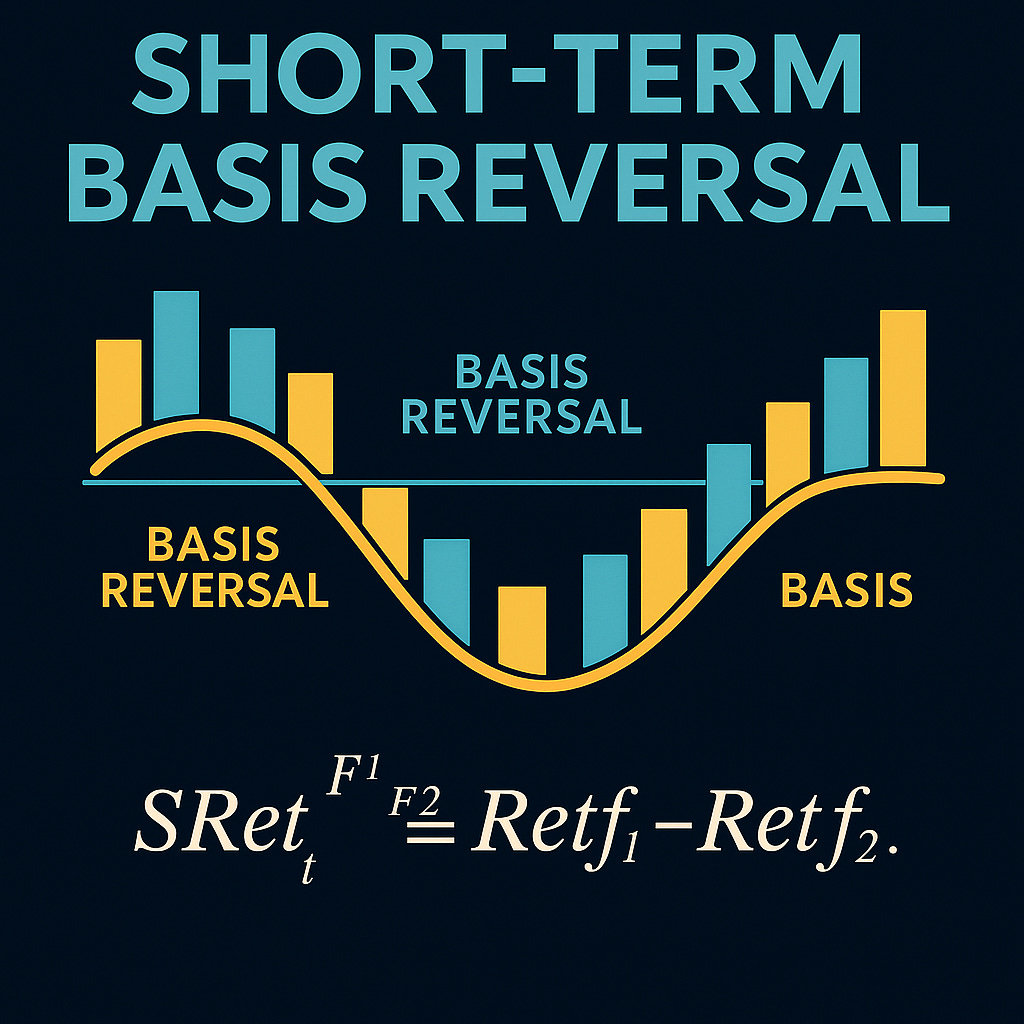
The central insight of the Short-Term Basis Reversal paper is based around the the weekly spread return (return difference) between the first (F1) and second (F2) nearby futures contracts. The weekly return spread is defined as

The paper suggests that the spread exhibits negative autocorrelation. In plain terms: if the front-month contract outperforms the second-nearby this week, causing an spread to become larger, it tends to underperform the next week and so the spread lowers. This also works vice versa. This effect will cause a high return spread this week to become low return spread next week, and vice versa.
This effect isn’t just a feature of individual contract reversals. It arises specifically from the relative mispricing across the curve. The first contract updates faster, often overreacting to short-term news, while the second lags behind. As a result, temporary dislocations emerge between the two, we look to building a trading strategy to capitalise on the inefficiency systematically, week after week.
The Edge
At QuantReturns, everything starts with the edge. Before we think about execution or strategy design, we ask: Is there a statistically consistent pattern in the data that we can rely on. It’s this edge that a strategy is built to capture. Without it, all we have are random rules and curve-fitted backtests
For this strategy exploration, rather than copy the paper directly by using commodities only, we applied the idea to a broader universe that includes both equity index futures and commodity futures.
The edge we’re trying to capture here is that the weekly return spread exhibit a strong negative autocorrelation. That basically means, when the spread is is high one week, it tends to predict the spread will be lower the following week. The reverse is also true. This relationship is captured in the regression below, where we expect the coefficient to be negative:

To extract the edge, we followed a simple and transparent process:
Defined a broad universe of futures, including global equity indices and commodities across metals, energy, agriculture, and livestock.
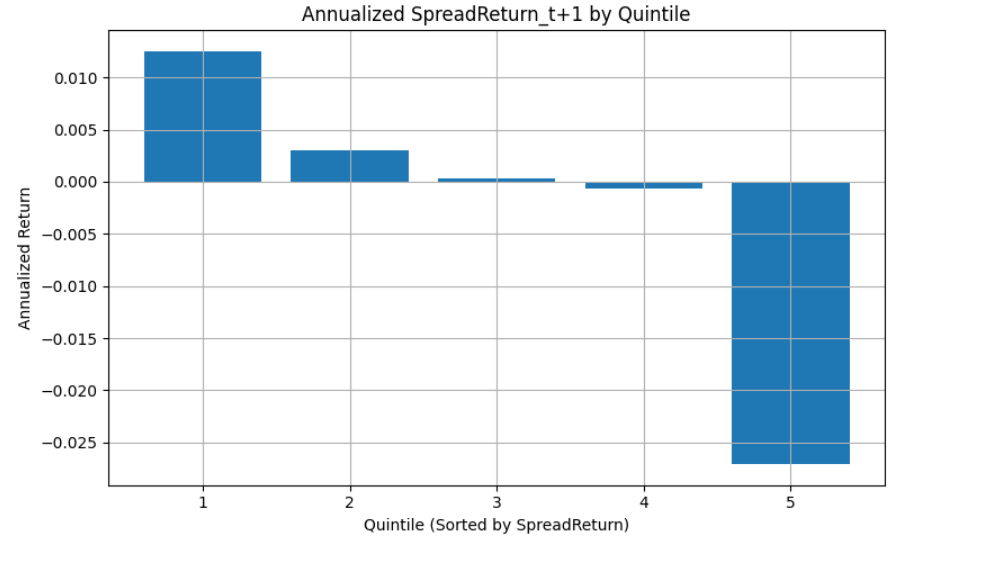
Ranked all symbols weekly based on their F1–F2 spread return from the previous week.
Grouped them into five equal-sized portfolios, from the most negative to the most positive spread return.
Calculated the average spread return of each portfolio for the following week.
Annualised each portfolios spread return.
The results are shown below:
We then ran a similar test using three portfolios, Low, Mid, and High mirroring the setup of the original paper.
High Portfolio – has 4 futures contracts with the highest weekly spreads
Low Portfolio – has 4 futures contracts with the lowest weekly spreads
Mid Portfolio – has all the remaining futures.
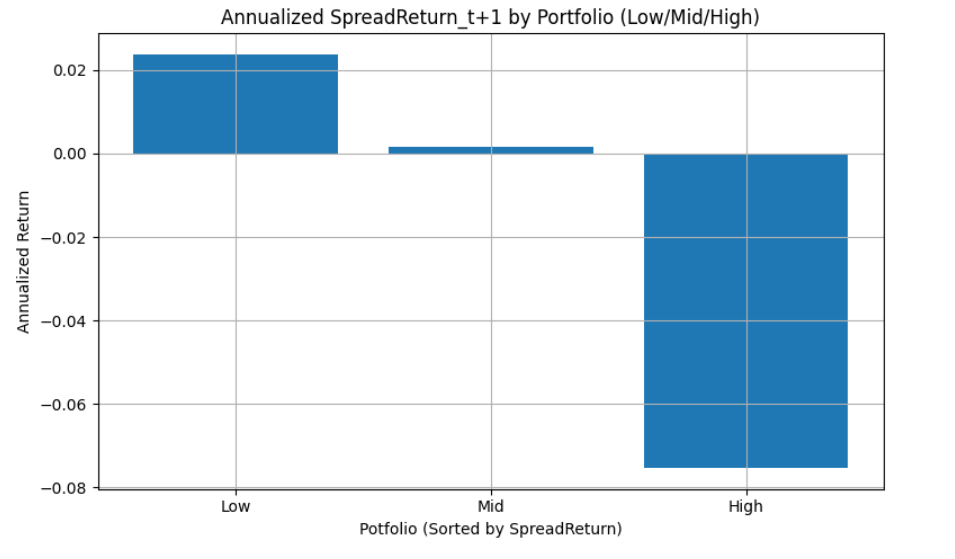
From the above charts we see a monotonic relationship between the current spread return and future performance:
The contracts with the most negative spread return tended to outperform (Portfolio 1 & Portfolio Low)
The contracts with the most positive spread return consistently underperformed (Portfolio 5 and Portfolio High).
And in between? The returns faded gradually and consistently from one end to the other.
This monotonic pattern from our results is important. It tells us this isn’t just a case of Q1/Low and Q5/High randomly diverging — it’s a smooth, ordered relationship across all portfolios. That’s a hallmark of a real, stable anomaly, not a fluke.
From the three-bin test, a simple Low minus High spread strategy returned nearly +10% annualized, with a t-stat of 3.91 — a statistically and economically strong signal. The five portfolio test showed the same structure.
So what we’ve captured here is a predictable reversal effect: when spread returns stretch too far in either direction, they tend to snap back the following week. That’s the kind of edge we love to see — and the kind we can build a strategy around.
The key point? We build strategies to extract edges — not the other way around. And this one’s worth capturing.
The Strategy
Each week on a Friday, we rank all futures markets by the spread return between their first and second nearby contracts (F1 minus F2).
Then we:
Go long the 4 markets with the most negative spread returns (expecting a rebound). This is 8 contracts (4 long and 4 short)
Go short the 4 with the most positive spread returns (expecting a reversal). This is 8 contracts (4 long and 4 short)
Equal weight each position and hold for one week.
This simple long/short, market-neutral setup exploits a consistent pattern: spread returns tend to mean-revert.
The below table shows the Equity Curve and key performance statistics of the QuantReturns implementation of the strategy.
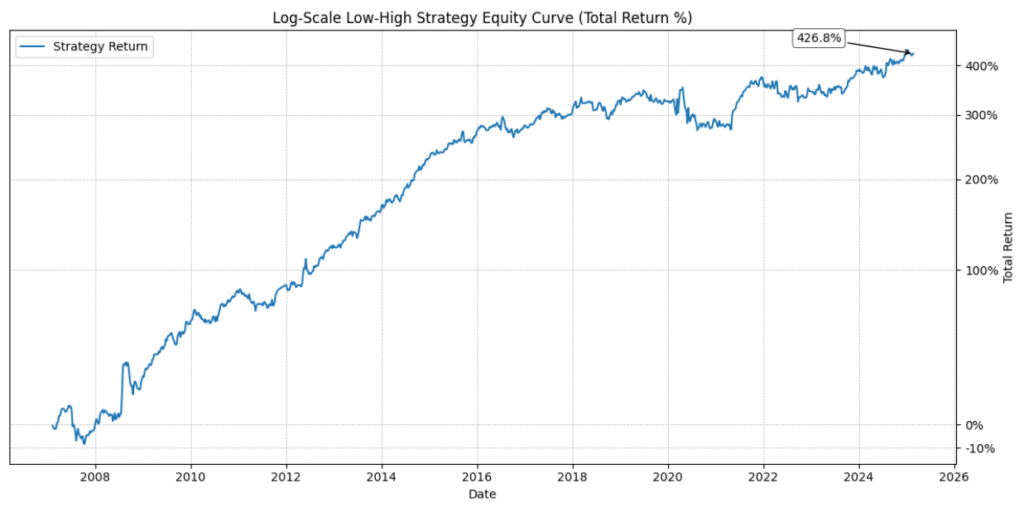
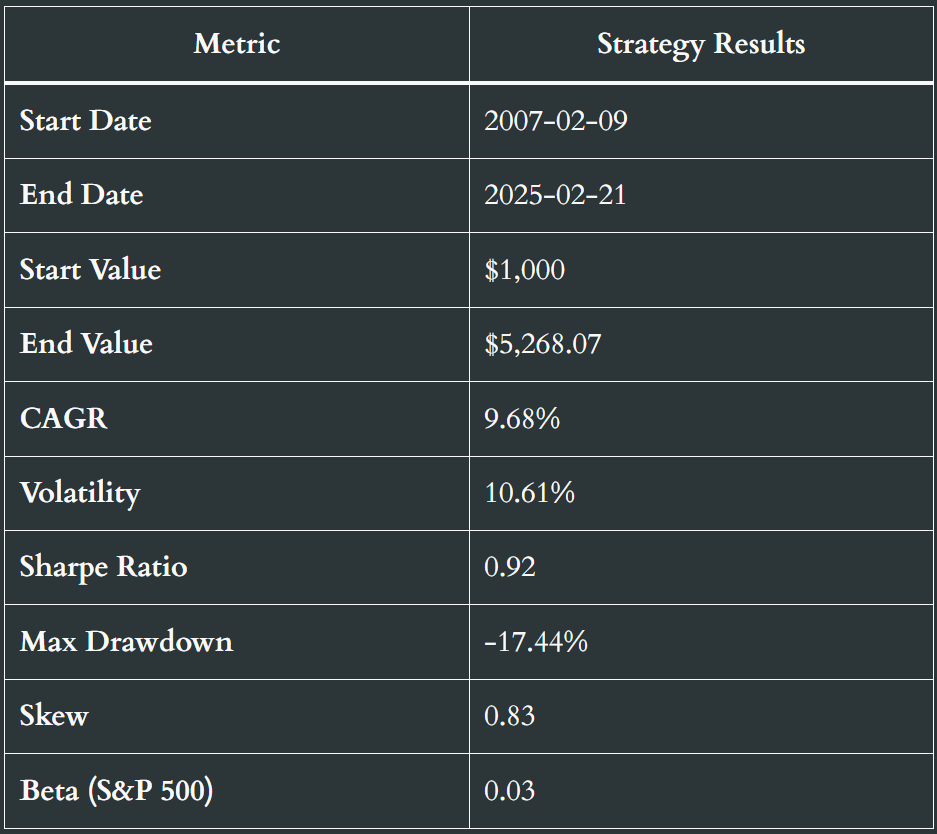
Over the full backtest period (2007–2025), the strategy delivered a 9.68% annual return with a Sharpe ratio of 0.92, all while maintaining a market-neutral profile (beta ≈ 0). Volatility was moderate at 10.6%, and the maximum drawdown was just -17%. The return distribution showed positive skew, suggesting more upside outliers than downside ones which is a favourable trait for of any strategy.
Notably, the strategy shows a Sharpe ratio above 0.9 and a market beta close to zero, which makes it particularly interesting from a diversification standpoint — especially when thinking about combining multiple return streams to improve overall risk-adjusted characteristics.
Final Thoughts
What makes this strategy interesting isn’t complexity but it’s consistency.
By looking at something as simple as the weekly spread between nearby futures contracts, the paper uncovers a clear and tradable pattern: what stretches tends to snap back. And it does so across a wide range of markets, without needing forecasts, fundamentals, or machine learning.
Of course, whether this edge persists going forward is an open question. But that’s exactly why we track these things daily at QuantReturns.com, to see if an idea that worked in the past still works in the wild.
Over the next few weeks, we’ll be spending some time adding this strategy to the QuantReturns.com strategy library, so you can track its daily performance.
In a future post, we’ll explore this strategy further with refinements and potential ways to improve our results.
Disclaimer
This website provides an assessment of the market and economic environment at a specific point in time. It is not intended as a forecast of future events or a guarantee of future results. The content is meant to present ideas for further research and analysis and should not be interpreted as a recommendation to invest.
This material does not provide individualized advice or recommendations for any specific reader. Forward-looking statements are subject to risks and uncertainties, and not all relevant risks related to the ideas presented may be covered. Actual results, performance, or achievements may differ materially from those expressed or implied.
The information is based on data gathered from sources we believe to be reliable. However, its accuracy is not guaranteed, it does not purport to be complete, and it should not be used as a primary basis for investment decisions.
Readers are encouraged to conduct their own due diligence and consider their individual investment objectives, risk tolerance, time horizon, tax situation, liquidity needs, and portfolio concentration. Consulting with a professional adviser is recommended to determine whether the ideas presented here are suitable for your unique circumstances.
By using the information in this article, you agree that the author and publisher are not liable for any direct or indirect losses resulting from your use of the material.